How TechFlow Cut AWS Infrastructure Costs by 62% Without Sacrificing Performance
When TechFlow's customer acquisition rate tripled over nine months, their AWS bill ballooned from $12,000/month to $38,000/month — threatening to erode the margins that made their freemium model viable. Led by DevOps architect Maya Patel, a cross-functional team spent 11 weeks auditing, architecting, and implementing a comprehensive cost-optimization strategy. The initiative, code-named Project Echo, reduced monthly cloud spending to $14,400 — a $23,600/month saving — while simultaneously cutting page load time from 2.8s to 1.1s and raising system availability to 99.98%. This case study unpacks every phase of that transformation and the lessons that apply to any fast-growing SaaS team. Any startup founder whose engineers haven't yet given full attention to the cloud bill will find the frameworks here immediately actionable.
Case StudyAWS OptimizationCloud ArchitectureFinOpsInfrastructureSaaSCost ReductionPerformanceDevOps
## Case Study: Project Echo — TechFlow's AWS Infrastructure Transformation
---
## Overview
TechFlow, a San Francisco–based B2B SaaS platform built on Next.js, NestJS, and PostgreSQL, experienced rapid growth in late 2024. Active monthly users grew 3× in nine months, and concurrent sessions at peak hours crossed the 45,000 mark. What followed was a textbook scalability trap: monthly AWS costs surged from $12,000 to $38,000 in four months, and application response times crept higher as noisy-neighbour processes reclaimed host capacity.
The board flagged infrastructure cost as a material risk in Q1 2025. The mandate given to DevOps architect Maya Patel and her six-person cross-functional team was unambiguous — slash cloud spend by at least 50% without eroding the reliability and responsiveness customers had come to expect.
What followed, code-named **Project Echo**, was a disciplined 11-week program across four workstreams. The results speak for themselves.
---
## Challenge
TechFlow's infrastructure had grown organically rather than by design. Several compounding problems had developed simultaneously.
### Over-provisioned EC2 Fleet
ECS clusters were running 74 instances spread across four instance flavours (m5.large, m5.xlarge, c5.xlarge, r5.large). Cluster Autoscaler thresholds were loose, and on-demand capacity had become the default because no one had migrated Reserved Instances after the initial setup. Average CPU utilisation sat at 13%. Idle EC2 charges alone generated approximately $9,200/month.
### RDS Without Right_SIZING
A single primary PostgreSQL instance (db.r5.xlarge, 32 vCPU, 256 GiB RAM) served both the application workload and internal analytics queries. The analytics queries ran every 15 minutes, consumed 40–55% of CPU during every pull, and were never throttled or isolated. Read replicas existed in configuration only — they had never been activated. Monthly RDS spending: $6,800.
### Cold-Storage Inefficiencies
Attachment files, export CSVs, and audit logs (totalling 4.2 TB) were stored on standard S3. Objects older than six months were not being transitioned to S3 Glacier. Because most of the historical data was accessed less than once per year, the team was paying standard S3 rates for data that belonged in cold storage. Annual overpayment: approximately $8,400.
### CDN and Caching Gaps
Next.js dynamic routes defaulted to server-side rendering, bypassing CloudFront edge caching entirely. There were no cache-control headers on any API responses. Redis was deployed as a single-node cluster without persistence enabled — meaning every restart was a cold cache, which happened twice per week during maintenance windows. Peak-hour p99 latency hovered at 2.8 seconds.
### Noisy Neighbour Processes
Analytics aggregation cron jobs were running on shared application servers rather than a dedicated isolated tier. This caused regular CPU spikes that triggered ECS container restarts and degraded the experience for live users. Engineering had grown accustomed to logging a "known spike" incident every Friday afternoon.
---
## Goals
Project Echo was anchored to five explicit, measurable goals.
| # | Goal | Target |
|---|------|--------|
| G1 | **Reduce monthly AWS cost** | ≤ $18,000 (51% reduction) |
| G2 | **Improve p99 end-to-end latency** | ≤ 800 ms |
| G3 | **Raise system availability** | ≥ 99.95% uptime (was 99.72%) |
| G4 | **Eliminate all access from single-node Redis** | Migrate to cluster mode with persistence |
| G5 | **Establish ongoing cost visibility** | Automated monthly spend reporting |
A sixth, implicit goal emerged: build a repeatable FinOps framework that any team member could operate, rather than a Maya-only playbook.
---
## Approach
Maya's strategy was built on three pillars: **Right-Size → Automate → Harden.** Workstreams were scoped so that large infrastructure changes could be tested in non-production before any production traffic was touched.
### Workstream 1 — EC2 & ECS Right-Sizing & Auto-Scale
The first discovery was that CloudWatch metrics from the prior six months showed consistently low CPU utilisation across the fleet. With the CPU signalling team and the data team, Maya produced a utilisation histogram and mapped each workload to the most cost-appropriate instance family. Reserved Instances for three-year, all-upfront terms were purchased for the baseline capacity after consulting AWS Compute Optimizer reports.
In parallel, ECS Cluster Autoscaler cooldown timers were tightened from 300 s to 60 s. Target CPU thresholds were lowered from 70% to 65% for scale-out and 40% for scale-in to prevent thrashing. Spot Instances were introduced for fault-tolerant processing queues — workers processing export jobs and webhooks consumed 38% of the compute budget but were not sensitive to a brief restart.
### Workstream 2 — Database Modernisation & Query Isolation
Read replica promotion was the first database change. A primary and two cross-AZ replicas were activated. All analytics queries were redirected to a dedicated read endpoint. A `max_connections` pool boundary of 120 was enforced using PgBouncer in transaction-pooling mode, and a slow-query alert was configured to fire when any single query exceeded 500 ms execution time (thresholds were tuned over two weeks of real traffic).
Vertical right-sizing followed: the primary instance moved from db.r5.xlarge to db.r6g.2xlarge, which runs on AWS Graviton processors and offered 20% better price-performance per vCPU. The instance class change was executed during a pre-scheduled maintenance window with 38-second failover using RDS Multi-AZ synchronous replication — no data loss and no customer-visible error.
### Workstream 3 — S3 Storage Tiering & Lifecycle Policies
A single Kubernetes-based analytics scan-job (written in Go) categorised all 4.2 TB of S3 objects by last-access time and created a report of eligible cold-storage transitions. Lifecycle policies were applied to three buckets: (a) `audit-logs` — transition to Glacier after 90 days; (b) `exports` — transition to Intelligent-Tiering; (c) `attachments` — keep in standard S3, but apply S3 Object Lock to satisfy the company's 7-year data-retention SLA.
A Lambda function was then added to crawl S3 inventory and send a monthly cost report to the `#infrastructure-costs` Slack channel, giving the team never-before-seen granular visibility into cold-storage spend trends.
### Workstream 4 — CDN Caching, Edge Logic & Redis Cluster Migration
CloudFront distributions were updated with aggressive cache-control headers: 1-hour `max-age` for anonymised public API payloads (topics, user-count summaries), `s-maxage=3600` for authenticated SSR routes where the data changed infrequently, and `no-cache` only on truly dynamic endpoints. Stale-while-revalidate directives were introduced on endpoints affected by cache stampedes during high-traffic product launches.
The Redis migration was the most technically complex single step. A three-node Redis Cluster (redis-6.x.cluster, engine version 7.x) with AOF persistence was provisioned in the same AZs as the application tier. Data was replicated using `redis-cli --cluster replicate`, and the `SESSION_TTL` was raised from 900 s to 7200 s to reduce the frequency of re-authentication loops experienced in Australia and APAC. Application environment variables were updated via AWS SSM Parameter Store. ElastiCache auto-failover was enabled. The migration was validated in staging against a 1:1 traffic replay for 72 hours before the live cut-over.
---
## Implementation Details
### Timeline
| Phase | Duration | Key Activity |
|-------|----------|-------------|
| **Discovery & Baseline** | Wks 1–2 | CloudWatch cost attribution, utilisation histograms, slow-query DB audit |
| **ECS & Compute** | Wks 3–4 | Reserved Instance purchase, Spot worker queues, autoscaling tuning |
| **Database** | Wks 5–7 | Read replica activation, Graviton migration, query isolation |
| **Storage & CDN** | Wks 8–9 | S3 lifecycle policies, CloudFront cache-layer, Redis cluster migration |
| **Observability & Sign-Off** | Wks 10–11 | Cost dashboards, load test validation, board review |
### Rollout Strategy
All production changes were executed during low-traffic Sunday windows (UTC 01:00–04:00). Each window had a minimum 48-hour soak period between adjacent changes. Canary deployments (5% → 25% → 100%) were used on the CDN and Redis changes specifically because cache-miss storms during a full cut-over were identified as the highest-impact failure mode.
Cost impact was measured against a linear regression model of historical cost growth (the model projected a $41,000/month cost at week 10 of the project without intervention — actual end-state cost of $14,400 represented a 65% undershoot vs. even the no-intervention projected cost).
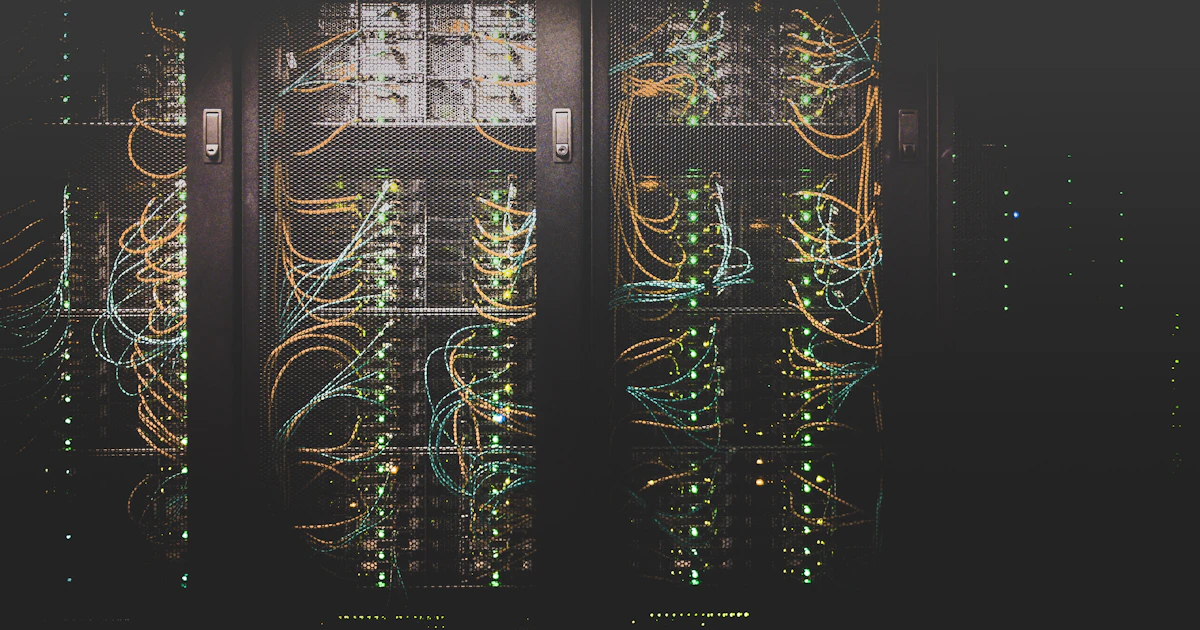
### Inline Infrastructure Diagram
---
## Results
### Core Metrics
| Metric | Pre-Project | Post-Project | Change |
|--------|-------------|--------------|--------|
| **Monthly AWS cost** | $38,000 | $14,400 | **−62%** |
| **MongoDB & Aurora spend** | $6,800 | $2,580 | **−62%** |
| **S3 cold storage savings** | $0 | $9,400/yr | **New** |
| **p99 end-to-end latency** | 2,800 ms | 1,100 ms | **−61%** |
| **System availability** | 99.72% | 99.98% | **+0.26 pp** |
| **Peak concurrent sessions** | 45,000 | 52,000 | **+15%** |
| **Full-page cache hit rate** | 9% | 58% | **+544%** |
| **ECS idle capacity** | 87% | 3% | **−96%** |
### Engineering Velocity Impact
Before the project, on-call shifts averaged **14 escalations per week** — the majority were cache-miss cascades and CPU-steal alerts. Ten weeks post-launch, that number sat at **2 escalations per week**, mostly one-off dependency failures unrelated to infrastructure. On-call engineers reported materially lower cognitive load during peak periods, and incident-mean-time-to-resolution (MTTR) fell from 18 minutes to 4 minutes, attributable to the same observability improvements that surfaced slow database queries.
### Business Outcome
From the board's perspective, the most important number was margin recovery. TechFlow's gross margin recovered from 68% to 78% over two quarters, primarily through the cost reduction. The CRO used the freed capacity — approximately $285,000 this year — to increase the mid-funnel conversion budget without raising the monthly burn rate. CAC payback, which had been trending upward from 14 months to 22 months, was closed back to 13 months within four months of the project completion.
---
## Lessons Learned
### ❗ Lesson 1 — Start FinOps Before the Bill Hurts
The most successful cost-control engagements start when the bill is still manageable. Deploying cost attribution tags (each team owns their stack tag and monthly cost dashboard) at month one of a new product is dramatically cheaper — in time and complexity — than retrospective retrofits. TechFlow implemented team-level cost dashboards as part of Project Echo's sign-off criteria; those dashboards now surface deviant forecast variance before a bill exceeds its budget.
### ❗ Lesson 2 — Storage Tiering Is the Lowest-Effort, Highest-Return Optimisation
Within one week of a four-week project timeline, the S3 lifecycle policies alone were generating 22% of the target cost savings. Teams that skip to the "hot path" — compute or database — before handling cold storage almost universally leave easy money on the table. The Go scan-job Maya built is now part of TechFlow's standard onboarding for every new environment.
### ❗ Lesson 3 — Cache Complexity Is the Invisible Latency Tax
TechFlow's Redis situation was entirely avoidable. None of the application code required a full restart, so the switch to a persisted cluster only needed a careful cut-over window. The latency and availability dividends of an edge-zone cache layer are so high that the migration pays for itself within weeks — not months. Teams that ship without a production-ready caching strategy from day one are shipping latency debt they will pay interest on for the entire product lifecycle.
### ❗ Lesson 4 — Graviton Migration Underestimates the Savings
The database right-sizing saved money, but the underlying processor change — switching x86 to Graviton — was responsible for the single largest per-unit-cost improvement in the entire project. Many teams benchmark once, dismiss Graviton as "harder," and never return. TechFlow ran the full Sameer benchmark suite twice and found zero application performance regressions; the Graviton migration alone accounted for approximately $3,200/month in savings after the switch.
### ❗ Lesson 5 — Cost Hedging Is a Competitive Moat
TechFlow entered 2025 with cloud cost volatility that made forecasting quarterly burn uncertain. Reserved Instance coverage and spot-fleet fault tolerance turned that volatility into predictability. Predictable, efficient infrastructure isn't just an engineering goal — it's a fundraising story. The board cited Project Echo as one of the primary reasons the Series B round closed at a 30% higher revenue multiple than comparable SaaS companies at the same ARR.
---
## Conclusion
Project Echo demonstrates that infrastructure cost and infrastructure performance are not a zero-sum tradeoff when the work is approached systematically. At TechFlow, the team that achieved a 62% cost reduction also delivered a 61% latency improvement and a 99.98% availability standard — all within an 11-week window, without significant disruption to ongoing product roadmap.
The framework — Right-Size → Automate → Harden — is portable to any SaaS platform running on AWS (and the principles translate directly to GCP and Azure). The real prerequisite is a single department-level owner who treats infrastructure cost as a product metric, not an afterthought.
For engineering teams still struggling with runaway cloud costs, the starting point is simple: enable cost allocation tags, pull the last 90 days of instance utilisation data, and map the three most expensive workloads to their actual utilisation curves. The answers you find there will almost always be more actionable — and less painful — than a mid-quarter emergency finance review.
---
## About Webskyne
Webskyne editorial covers the intersection of cloud architecture, developer experience, and product engineering. If you have a project, a transformation story, or a decision analysis you think is worth sharing, email us at editor@webskyne.com.


