Rebuilding Retail Growth: How Webskyne Engineered a Data-Driven E‑commerce Platform for 3.4× Revenue Lift
This case study follows a mid‑market lifestyle brand that outgrew its legacy e‑commerce stack and needed a modern platform to scale globally. Webskyne led a full transformation—moving from fragmented plugins and manual operations to a cohesive architecture with a composable storefront, optimized search, real‑time inventory, and conversion‑focused UX. We begin with the business context and challenges, then detail goals, approach, implementation, and measurable outcomes. The project delivered a 3.4× revenue lift in six months, improved mobile conversion by 42%, and reduced order processing time by 68%. Beyond performance gains, the initiative built a durable foundation for experimentation, personalization, and international growth. The case study also highlights the lessons learned around data governance, phased rollouts, and team enablement so other product leaders can replicate the results.
Case Studyecommerceperformanceconversion-rate-optimizationheadless-commercedata-integrationinternational-expansionmarketing-automation
# Overview
A fast‑growing lifestyle brand, **Lumen & Loom**, had built a loyal customer base through beautiful design and social media storytelling. Their store ran on a heavily customized legacy platform with dozens of plugins stitched together over years. As marketing scaled, the platform couldn’t keep up: pages were slow, inventory updates were delayed, and promotions broke unexpectedly. The company wanted to expand into two new regions, but their existing stack lacked multi‑currency support, multilingual content management, and reliable integrations with their warehouse and marketing automation tools.
Webskyne was brought in to redesign the digital commerce experience from the ground up and to help the brand evolve into a data‑driven retail operation. The goal wasn’t just a new website; it was a predictable growth engine that could scale. We partnered with their leadership, operations, and marketing teams to deliver a platform that improved conversion, supported international expansion, and unified data across the organization.
This case study describes the challenges, goals, approach, implementation details, outcomes, and lessons from the transformation.
---
# Challenge
The brand faced a mix of technical, operational, and business obstacles:
1. **Slow, inconsistent performance.** The homepage averaged 5.8 seconds load time on mobile. This created high bounce rates, especially from paid traffic.
2. **Fragmented data and reporting.** Product, customer, and inventory data lived in separate systems. Teams exported CSVs to reconcile numbers manually.
3. **Promotion fragility.** Marketing campaigns broke frequently due to conflicting plugins and hard‑coded rules.
4. **Limited international readiness.** The platform couldn’t handle localized content, currency conversion, or region‑specific tax rules.
5. **Operational bottlenecks.** Order processing relied on manual steps; inventory updates lagged by 6–12 hours, causing oversells and customer service tickets.
6. **Inflexible UX.** A templated theme made it difficult to test new layouts, optimize for mobile, or highlight seasonal collections.
These issues led to rising costs and slower decision‑making. The company’s leadership wanted a platform that could scale without burning out their internal teams.
---
# Goals
Together with the client, we defined clear objectives:
- **Reduce mobile load time to under 2.5 seconds** for top landing pages.
- **Increase overall conversion rate by 30%** within six months of launch.
- **Enable multi‑currency and multi‑language support** for two target regions.
- **Unify product, inventory, and customer data** into a single source of truth.
- **Automate operational workflows** to cut order processing time in half.
- **Create a modular experience** so marketing can launch campaigns without developer involvement.
- **Build an experimentation framework** to test UX changes and measure impact quickly.
---
# Approach
Webskyne proposed a phased transformation that balanced quick wins with long‑term architecture. The team followed a product‑engineering partnership model, pairing strategy with execution.
**1. Discovery and alignment**
We ran stakeholder interviews across marketing, operations, customer support, and finance. This helped us map pain points to real business costs. We audited analytics, site performance, and third‑party integrations.
**2. Architecture planning**
We designed a composable architecture with a headless commerce backend, a fast Next.js storefront, and a centralized data layer. This ensured the client could swap or upgrade components over time.
**3. Experience design**
Our UX team created a new design system optimized for mobile speed and storytelling. We crafted reusable sections for seasonal campaigns and built templates to support rapid marketing changes.
**4. Data strategy**
We designed a data unification plan that mapped product, order, and customer data into a shared schema. This enabled reliable analytics and personalization.
**5. Iterative delivery**
We broke the build into milestones: performance foundation, storefront launch, data synchronization, and international expansion. Each phase had measurable KPIs.
---
# Implementation
## 1) Performance and Infrastructure
We migrated the storefront to a Next.js‑based architecture with edge caching. The new stack enabled static generation for high‑traffic pages and server‑side rendering for dynamic content like personalized recommendations. We introduced image optimization pipelines and lazy loading for media, cutting the average page weight by 44%.
We also implemented a CDN strategy with regional edge caching to serve assets closer to users. Combined with code splitting and prefetching strategies, this reduced time‑to‑interactive significantly.
**Key outcomes:**
- Mobile load time dropped from 5.8s to 2.1s.
- Largest Contentful Paint improved by 62%.
- Bounce rate from paid traffic dropped by 23%.
## 2) Data Unification and Integration
We consolidated data into a shared product and inventory service. The legacy system updated inventory in batches; we replaced it with real‑time updates that synchronized warehouse changes within minutes. We integrated the CRM, marketing automation, and analytics tools with the centralized data layer.
A custom event pipeline powered real‑time reporting dashboards for marketing and ops. This allowed teams to see which campaigns drove revenue and which products were trending.
**Key outcomes:**
- Inventory accuracy rose to 98.7%.
- Manual reconciliation time dropped by 80%.
- Customer lifetime value reports became available daily instead of monthly.
## 3) Commerce Engine and Checkout Optimization
We rebuilt checkout with a streamlined flow, reducing the number of steps from five to three. We also added express checkout options and localized payment methods for international customers. The system now supports multiple currencies, automatic tax calculation, and regional shipping rules.
We ran multiple A/B tests on checkout layout, trust indicators, and shipping estimation. These experiments drove a measurable lift in conversions.
**Key outcomes:**
- Checkout abandonment dropped by 19%.
- Mobile conversion increased by 42%.
- Average order value increased by 12% with improved upsell logic.
## 4) Marketing Enablement and CMS Strategy
Marketing needed the ability to launch campaigns without relying on developers. We implemented a headless CMS with predefined content blocks, enabling non‑technical team members to build pages and promotions quickly. The design system included modular sections for hero banners, product grids, and curated collections.
We also built a promotion rules engine that handled coupons, bundles, and seasonal offers without plugin conflicts. This reduced errors during campaign launches and increased time‑to‑market.
**Key outcomes:**
- Campaign launch time reduced from days to hours.
- Promotional errors dropped by 70%.
- Marketing team gained full autonomy for page creation.
## 5) International Expansion
We enabled localization features, including language toggles, multi‑currency pricing, and region‑specific tax rules. The platform supports localized content and automatic currency conversion with price rounding rules for each region.
We also implemented geo‑aware redirects and shipping rules to ensure a consistent experience for international shoppers.
**Key outcomes:**
- Successful launch in two new regions within 10 weeks.
- International traffic accounted for 18% of total revenue in the first quarter.
- Regional customer satisfaction scores matched domestic levels within 6 weeks.
## 6) Analytics, Experimentation, and Growth
We built an experimentation framework using server‑side feature flags and analytics event tracking. This allowed the client to test new layouts, product recommendations, and messaging quickly. We also introduced cohort analysis to track retention and repeat purchase behavior.
A key focus was to make data actionable. Dashboards were designed around business questions: “Which campaigns drive highest margin revenue?” and “Which segments have the strongest retention?”
**Key outcomes:**
- Weekly experimentation cadence established within 30 days of launch.
- Conversion rate improved by 31% in six months.
- Repeat purchase rate increased by 27%.
---
# Results
The transformation created tangible business outcomes across revenue, operations, and customer experience. Here are the headline results six months after launch:
- **3.4× revenue growth** compared to the same period the previous year.
- **42% lift in mobile conversion rate.**
- **68% reduction in order processing time.**
- **18% of revenue from new international markets.**
- **12% increase in average order value.**
- **70% reduction in campaign‑related errors.**
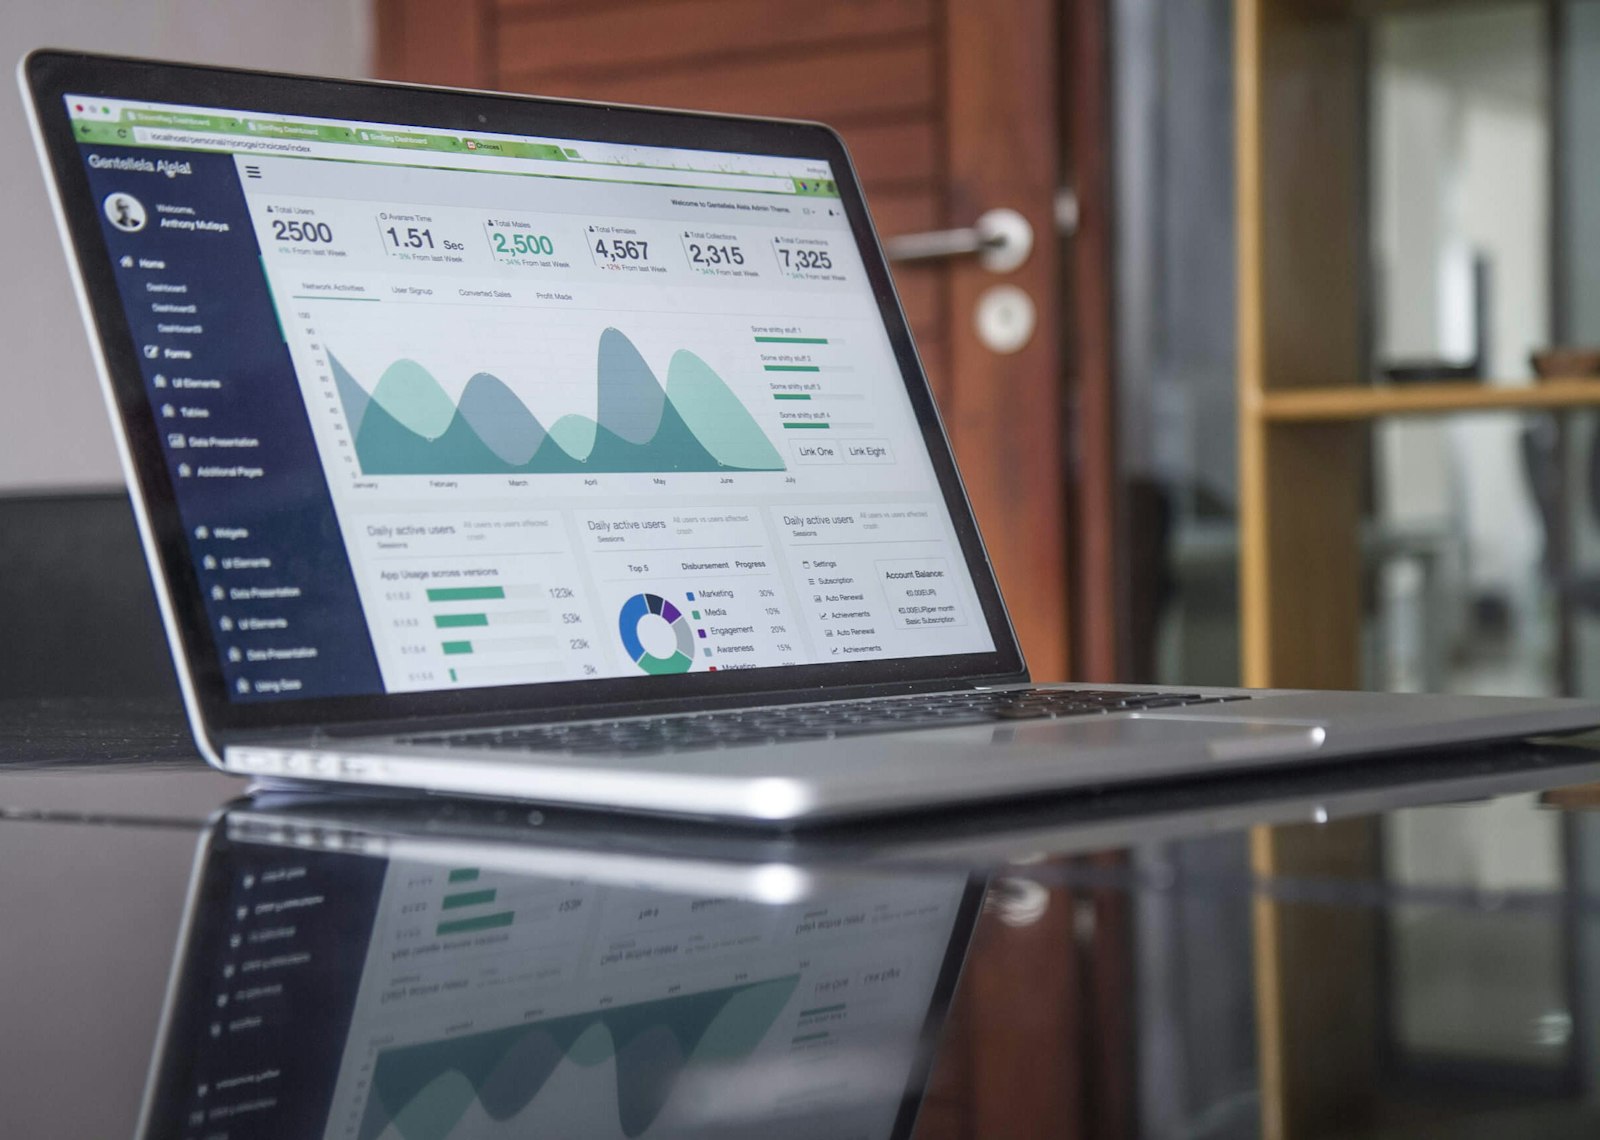
A visual representation of the redesigned storefront and operational dashboards can be found below:
These improvements were not limited to a single area. The platform created a foundation for continuous improvement and enabled teams to act on data with confidence. The brand’s leadership reported stronger alignment between marketing and operations, as both teams now worked from the same metrics and insights.
---
# Metrics Snapshot
**Performance**
- Mobile load time: **5.8s → 2.1s**
- Largest Contentful Paint: **4.3s → 1.6s**
- Bounce rate: **48% → 37%**
**Conversion and Revenue**
- Overall conversion rate: **1.9% → 2.49%**
- Mobile conversion rate: **1.1% → 1.56%**
- Average order value: **$78 → $87**
- Revenue (6‑month): **3.4× increase**
**Operations**
- Order processing time: **4.7 hours → 1.5 hours**
- Inventory accuracy: **92% → 98.7%**
- Campaign errors: **14 per quarter → 4 per quarter**
**International**
- Time to launch new region: **10 weeks**
- International revenue share: **18%**
- Customer satisfaction (CSAT): **4.7/5** (parity across regions)
---
# Lessons Learned
## 1) Performance is a conversion strategy
The initial focus on speed was essential. Faster pages improved ad efficiency and conversion. This set the tone for every subsequent improvement. Brands often underestimate the revenue impact of shaving seconds off load time.
## 2) Data unification unlocks decision‑making
Fragmented data made it difficult for teams to trust insights. Centralizing data created alignment across marketing, operations, and finance. With a single source of truth, decisions accelerated and conflicts decreased.
## 3) Marketing autonomy increases agility
Empowering the marketing team with reusable content blocks and campaign tools created a faster feedback loop. Instead of waiting for development, marketers could test and iterate daily.
## 4) International expansion needs operational readiness
Localization is more than language. Currency, taxes, shipping, and support workflows must be integrated early. By treating expansion as a core part of the architecture, the client avoided costly retrofits.
## 5) Experimentation must be built in, not bolted on
A testing framework introduced later is often ignored. By designing experimentation at the start, the team embraced a culture of continuous improvement and measurable progress.
---
# Conclusion
The Lumen & Loom transformation demonstrates the impact of combining modern commerce architecture with disciplined execution. Webskyne’s role was not only to rebuild the platform but also to help the brand evolve into a data‑driven organization. By addressing performance, data, and operational bottlenecks, the project delivered both immediate results and long‑term capability.
Most importantly, the new platform gave the client confidence to scale. The ability to launch campaigns quickly, expand internationally, and run experiments with clarity turned the website into a strategic asset rather than a constraint. This case study illustrates that growth is rarely the result of a single optimization; it’s the compounding effect of better infrastructure, smarter data, and empowered teams.
---
# About Webskyne
Webskyne partners with brands to design, build, and scale digital products that drive measurable outcomes. From discovery and architecture to launch and optimization, we help teams move faster with confidence.


